###################################################################
# plotGcode.py
#
#	python plotGcode.py [render or plot] [input gcode file name]
###################################################################

import matplotlib.pyplot as plt
import time
import sys
import os
import requests
import math
import random

VIRTUAL_SENSOR_IP_ADDRESS = "192.168.11.162"
constOutputMaxRange = 1024

# Global Variables
mode = "render"
prevPos=(1024,0)
penUp = False
stepId = 0

# Check if there are enough arguments
if len(sys.argv) != 3:
    print(f"Usage: python {sys.argv[0]} [render or plot] [input gcode file name]")
    exit()

if not(sys.argv[1]=="render" or sys.argv[1]=="plot"):
    print(f"Second parameter must be 'render' or 'plot'.")
    exit()

# Check if the file exists and is readable
if not(os.path.isfile(sys.argv[2]) and os.access(sys.argv[2], os.R_OK)):
    print(f"The file {filename} does not exist or cannot be read!")
    exit()

# Get the input parameters
mode  = sys.argv[1]
filename = sys.argv[2]

#==========================================
# Calculate distance between two points
#==========================================
def distance(point1, point2):
	x1, y1 = point1
	x2, y2 = point2
	return round( math.sqrt((x2 - x1) ** 2 + (y2 - y1) ** 2), 1 )


#==========================================
# Generate a random between 1 to 255 that doesn't equal to prev number
#==========================================
def my_random_number(prevRandomNumber):
    while True:
        newRandomNumber = random.randint(1, 255)
        if newRandomNumber != prevRandomNumber:
            break
    return newRandomNumber


#==========================================
# command possible input values:
#	   when 0 => position
#	   when 1 => up		(i.e. 11 in raw)
#	   when 2 => down	(i.e. 22 in raw)
#==========================================
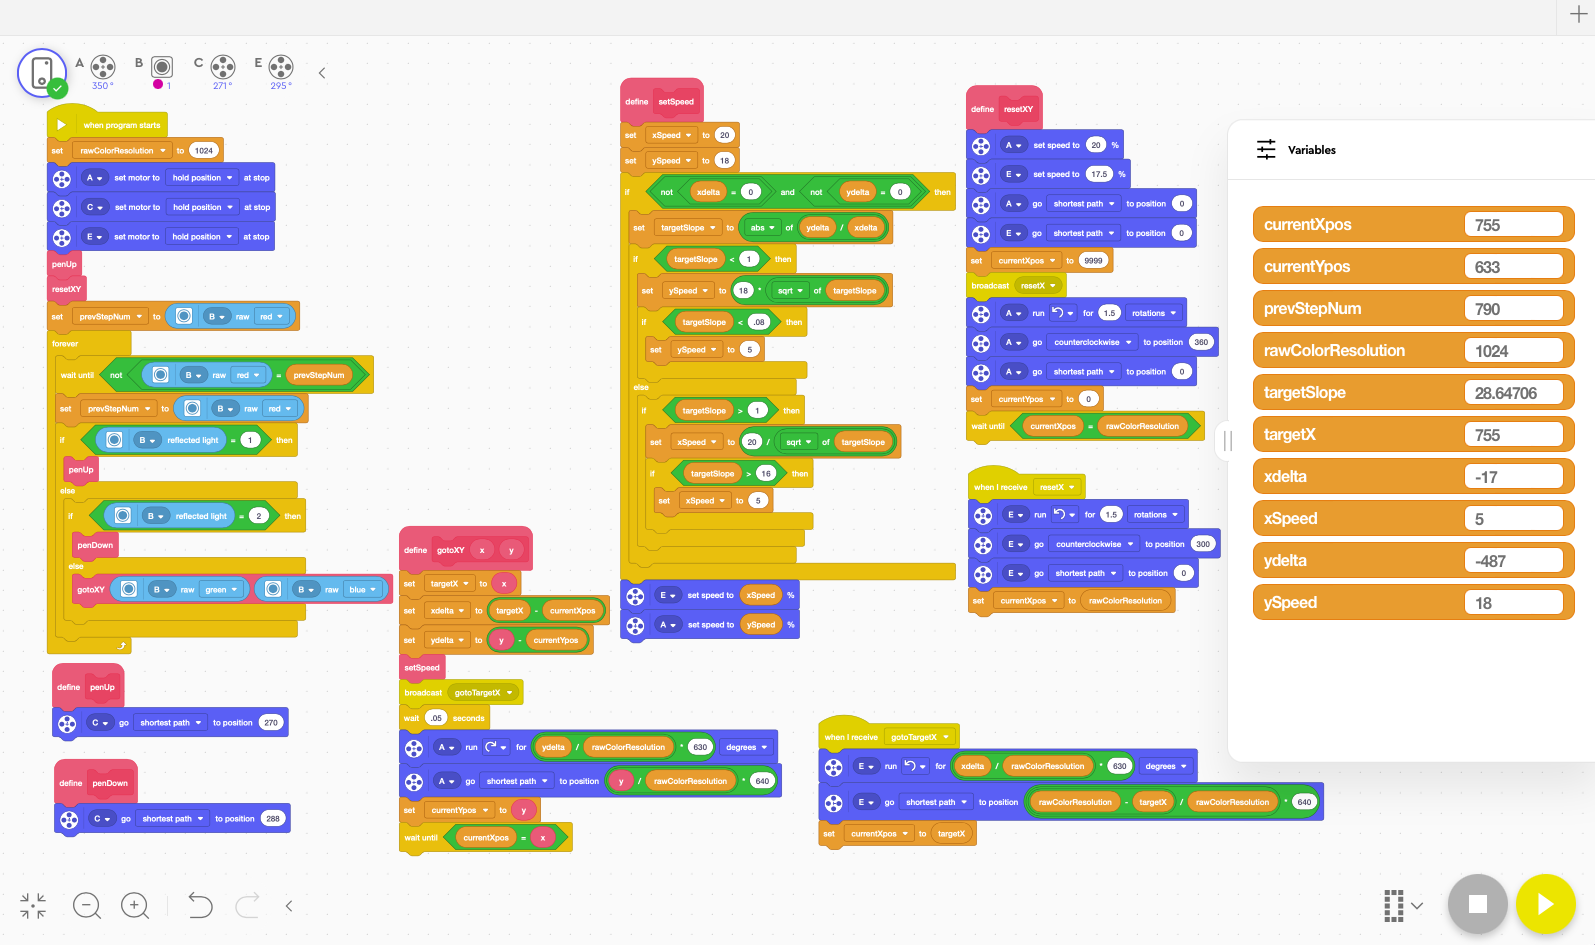
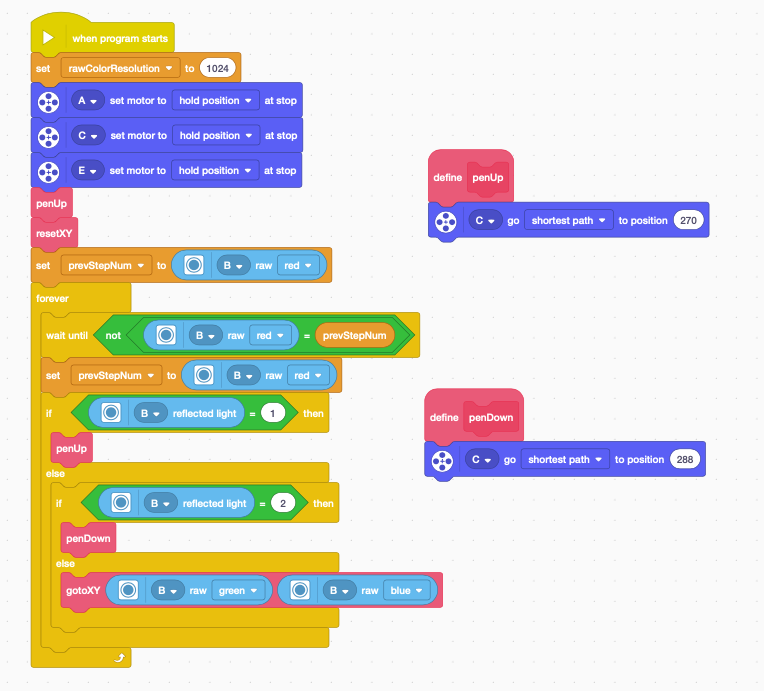
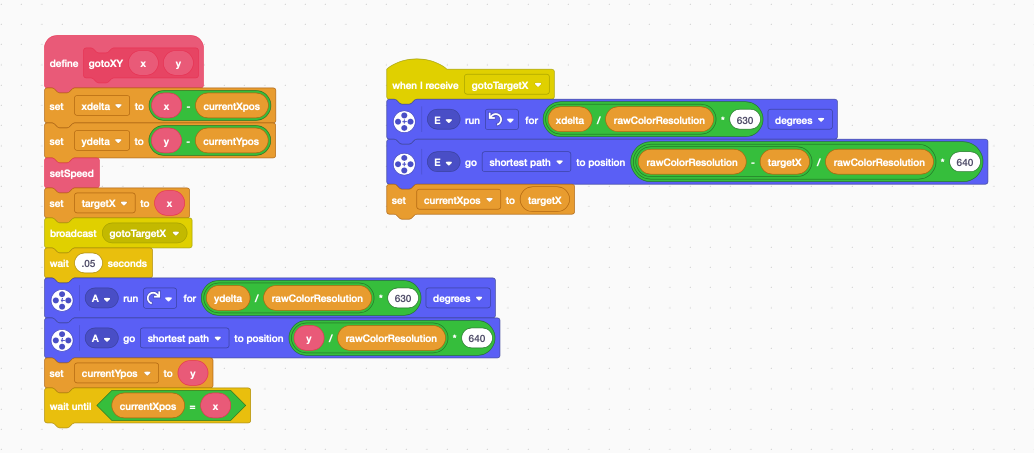
def sendPlotCommand( command, x, y ):
	global stepId

	reflection = 0
	if command == 1:
		reflection = 11
	elif command == 2:
		reflection = 22

	stepId = my_random_number(stepId/255*1024)

	endpoint = f"http://{VIRTUAL_SENSOR_IP_ADDRESS}/set?t=c&r={stepId}&g={x}&b={y}&R={reflection}"
	requests.get( endpoint )
	#print( endpoint )


#==========================================
# Receive point command either for rendering on screen or for plotting on our xy plotter
#==========================================
def execPointCmd(point):
	global prevPos, penUp

	# Pen up/down command
	if point[1] == 9999:
		if point[0] > 0:
			penUp = True
			if mode == "plot":
				sendPlotCommand(1, 0, 0)
				time.sleep( 0.8 )
		else:
			penUp = False
			if mode == "plot":
				sendPlotCommand(2, 0, 0)
				time.sleep( 0.8 )

	# Set xy position
	else:
		# When Pen Down
		if penUp == False:
			# If it's not the start of a line
			if prevPos[0] != -9999:
				if mode == "render":
					plt.plot( (prevPos[0], point[0]), (prevPos[1], point[1]), color='black')

		# Perform Plot movements
		if mode == "plot":
			sendPlotCommand( 0, point[0], point[1] )
			motionDuration = distance(prevPos, point) / 200 + 0.2
			#print ( f"duration= {motionDuration} for line from ({prevPos[0], prevPos[1]}) to ({point[0], point[1]})")
			time.sleep( motionDuration )

		prevPos = point


# Global Variables
minX = 9999
minY = 9999
maxX = 0
maxY = 0

# The buffer array that will be used to store our output data
points = []

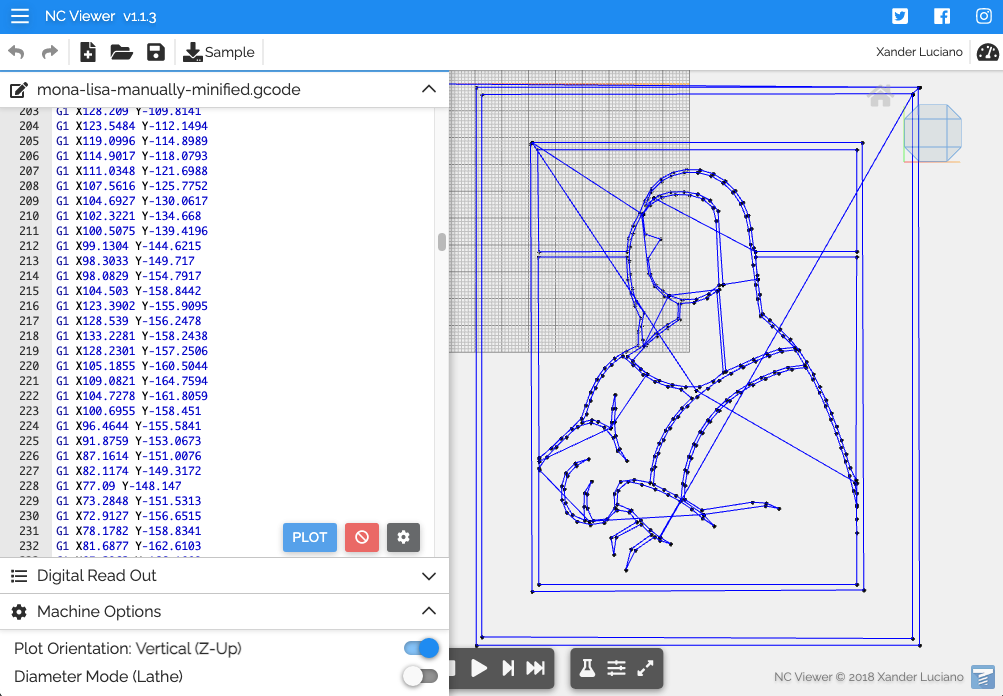
with open(filename, 'r') as f:

	# Loop through each segment
	for line in f:
		# G1 lines are the lines that is responsible for moving the plotter xyz location
		if line.startswith('G1'):
			# Handle lines with XY values first
			x_str = line.split('X')[-1].replace('\t', ' ').split(' ')[0]
			try:
				x = float(x_str)
				y_str = line.split('Y')[-1].replace('\t', ' ').split(' ')[0]
				y = float(y_str)
				points.append((x, y))		# append to points[] array

				# Update minX, minY, maxX, MaxY values
				if ( x > maxX ):
					maxX = x
				if ( y > maxY ):
					maxY = y
				if x < minX:
					minX = x
				if y < minY:
					minY = y
			except ValueError as err:
				# Handle Z movement lines
				try:
					z_str = line.split('Z')[-1].replace('\t', ' ').split(' ')[0]
					z = float(z_str)
					points.append((z, 9999))		# append to points[] array
				except ValueError:
					pass

# Calculate width and height of drawing
maxW = maxX - minX
maxH = maxY - minY


# Calculate the scaling factor in order for the drawing to fit into 1024 range.
# Also calculate offset in order to center the image in the square plot platform
scaleFactor = maxW
if maxH > maxW:
	scaleFactor = maxH
if maxH < maxW:
	offset = (maxW - maxH) * constOutputMaxRange / scaleFactor / 2;
else:
	offset = (maxH - maxW) * constOutputMaxRange / scaleFactor / 2;


# loop through each item in the array again
for i, point in enumerate(points):
 	# NOT Command to set Pen up or down
	if point[1] != 9999:
		# Scale and shift the position into the (0,1024) range.

		# shifting to start from 0 with no negative values
		point = ( point[0] - minX, point[1] - minY )

		# Scale segment so that the coordinate fits in the ( constOutputMaxRange x constOutputMaxRange ) grid
		point = ( point[0] * constOutputMaxRange / scaleFactor, point[1] * constOutputMaxRange / scaleFactor )

		# Center the side that's narrower
		if maxH < maxW:
			point = (point[0], point[1] + offset)
		else:
			point = (point[0] + offset, point[1])

	execPointCmd(point)


if mode == "render":
	# Set the limits of the axis to fit the drawing
	plt.xlim(0, constOutputMaxRange)
	plt.ylim(0, constOutputMaxRange)
	plt.axis('equal')

	# Show the final result
	plt.show()
